QGIS is not as easy to work with regarding spatial statistics as its commercial counterpart ArcGIS. However, QGIS does have some plugins that can do some great statistical analysis. One example is the Attribute Based Clustering plugin, created by the QGIS-contributor ekazakov.
The plugin creates clusters based on the attributes of a vector layer, not the spatial distribution of the data. The clusters are calculated using either a hierarchical or a k-means algorithm. If you are using the hierarchical clustering, you can define the weight of each attribute that you want to include in the cluster analysis. The higher the weight, the stronger the effect, or impact, the attribute will have on how the clusters are created. You can read more about the plugin on ekazakov’s own website which includes a tutorial of the plugin.
I recorded a video for a GIS course where I give an example on how you can use the plugin, and what the result looks like, using data from Malmö, a city in southern Sweden.
The data was from Malmö Stad and can be downloaded here as an Excel file. The three attributes that I used were:
- Amount of people with a longer education (“Eftergymnasial“) in 2019
- Amount of people with a foreign background (“Utländsk bakgrund“) in 2019. NB: This number includes people born in the country, but where both parents are foreigners.
- Percentage of the population who are employed (“Förvärvsarbetande“) in 2018
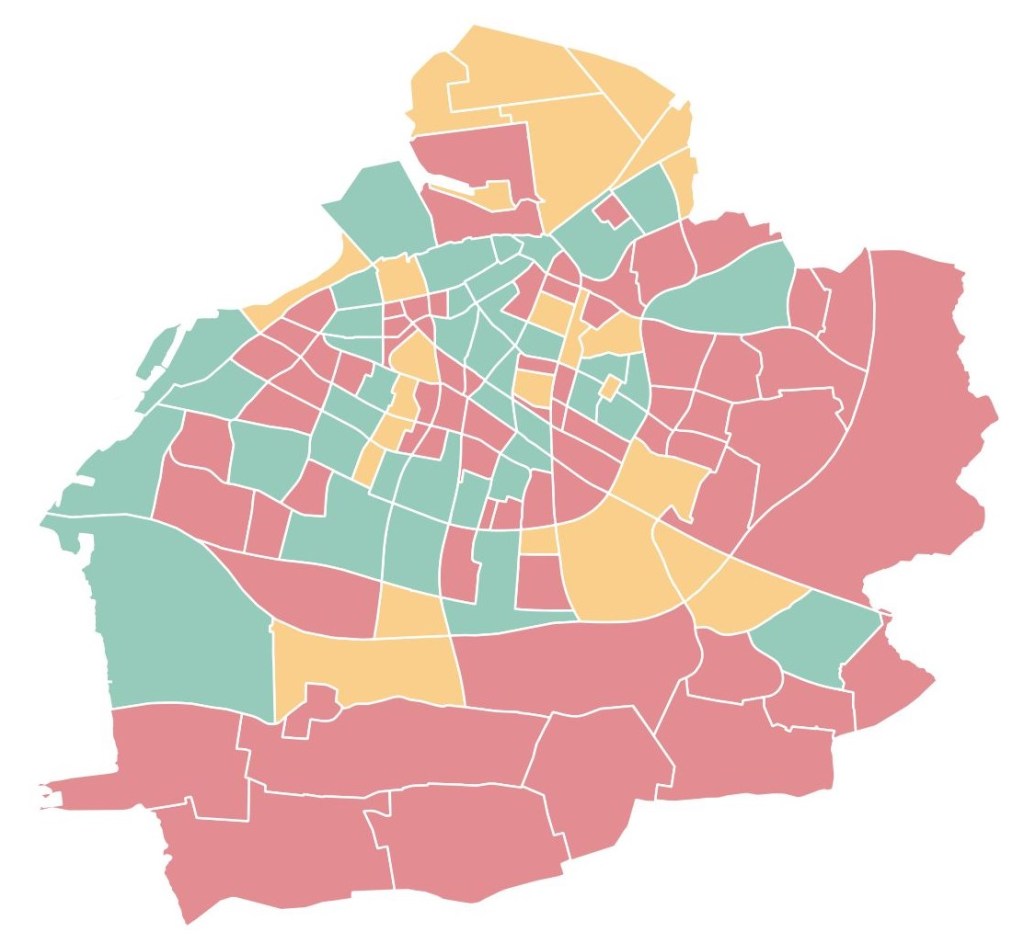
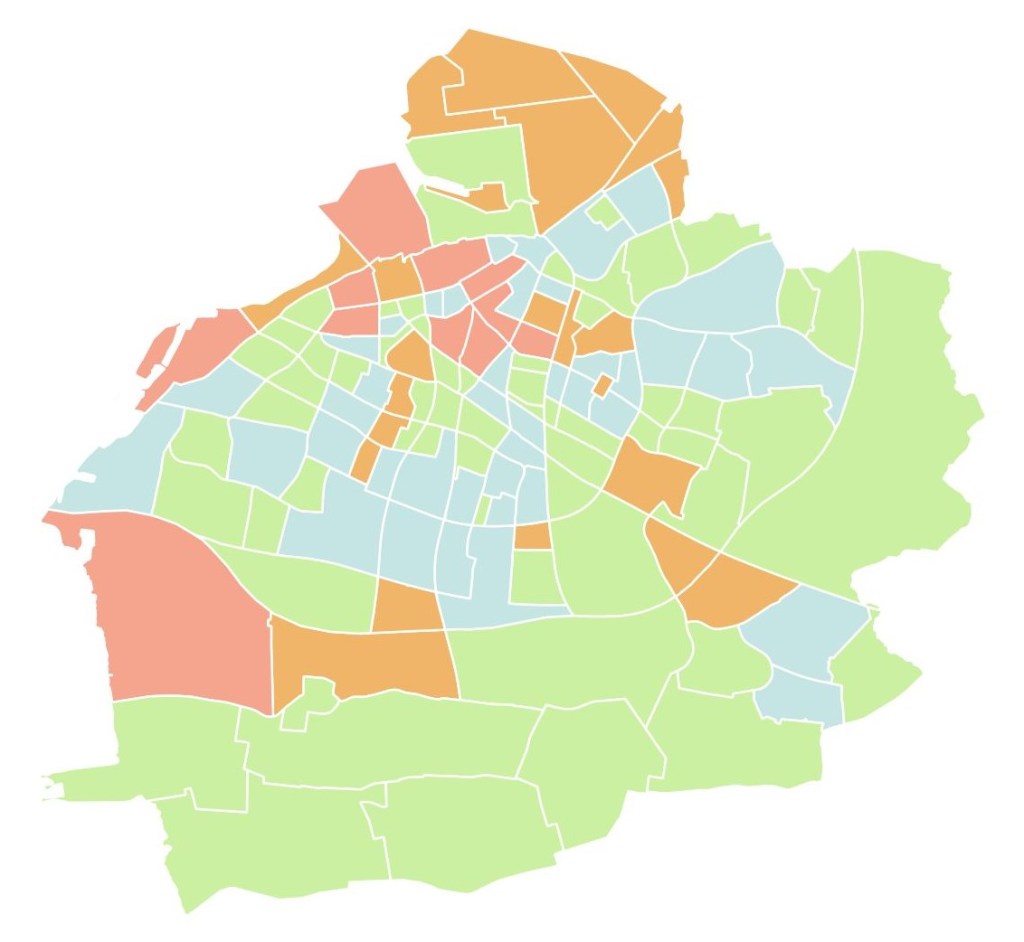
Below you can see the difference between having 3 and 4 clusters, using the same settings otherwise: