Personally I don’t find the Copernicus Open Access Hub very intuitive to use, so I wanted to provide an example of how I download data from the website.
For this example I want to download a single Sentinel 2 (A or B) image from the northern part of Jutland in Denmark. I want it to be cloud free and it should be as recent as possible.
Here’s how I would do that:
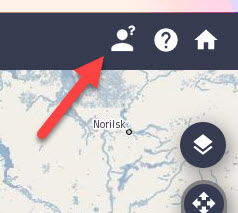
1. Login to Copernicus Open Access Hub by clicking the confused looking person in the top right corner
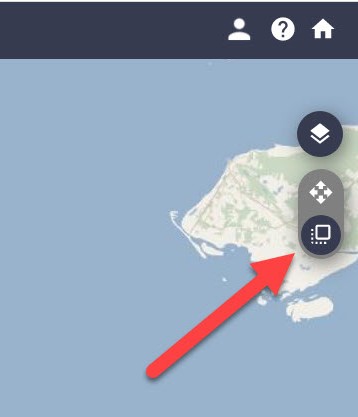
2. Click on “Switch to Navigation Mode” in order to select the area that you are interested in
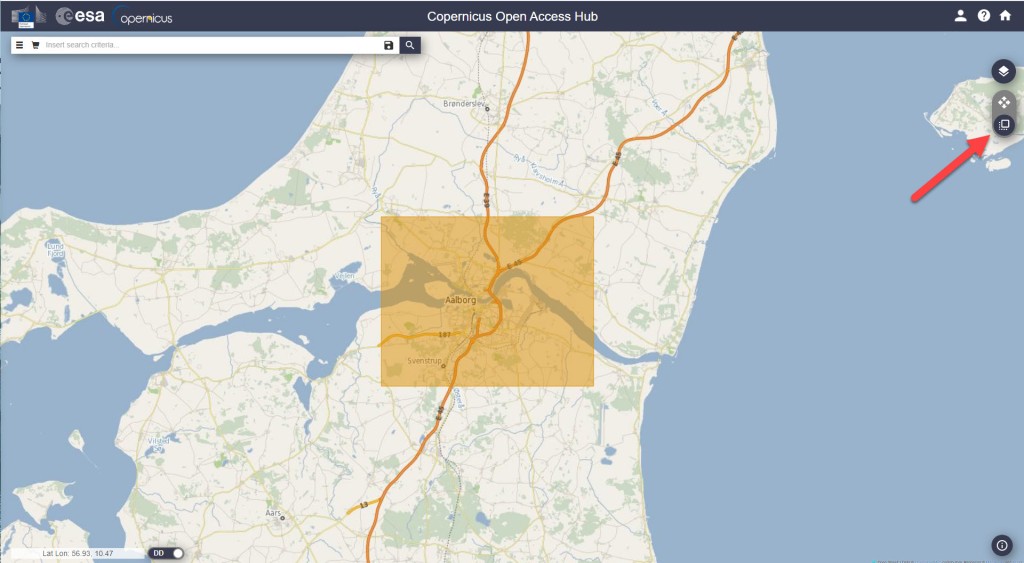
3. Select the area
4. Click on the filter-button left of the search bar, and make the following selections:
- Select Sort by : Sensing date
- Select the time period you are interested in (choose Sensing period)
- Select the Sentinel satellite mission you want data from
Tip: If e.g. you just want any image from Sentinel 2, you don’t have to select anything in the Satellite platform dropdown, just leave it empty. - Select cloud cover % if that is relevant. For Sentinel 2, I usually set the cloud cover very low, e.g. “[0 to 10]”.
5. Click on the search symbol in the top, and you should see a list of available images from your area.
If you don’t see any images, try to change the cloud cover or expand the selected time period.
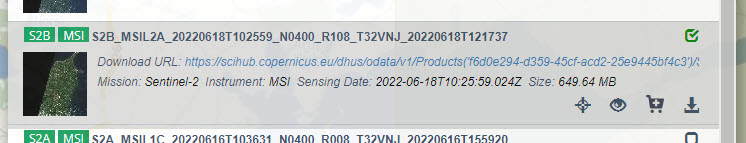
6. Select the image that suits your needs and download it.
The download might take a while. The most recent image I downloaded took ~3 min to download and the size was ~0.6GB.

Once the download is finished, the next challenge is to find the raster files in the labyrinth of subfolders. I found mine here:
C:\Users\username\Downloads\S2B_MSIL2A_20220618T102559_N0400_R108_T32VNJ_20220618T121737\S2B_MSIL2A_20220618T102559_N0400_R108_T32VNJ_20220618T121737.SAFE\GRANULE\L2A_T32VNJ_A027590_20220618T102602\IMG_DATA
Here you can find three resolutions folders (R10m, R20m, R60m). In my case I chose R10m.
The data is in the JP2-format, which a program like QGIS should not have any problem reading.
That’s it — good luck with downloading data on your own!
If you want to see what I used the sentinel image for, you can read about it in this post.