Solving a “gaps and islands” problem using LAG [SQL]

At my work, we have a lot with sensors installed all over the city, which take measurements at certain intervals, e.g. once per minute. For example, a water sensor, which every minute measures the current level of rain water in an underground basin.

Most of the time the sensor will measure zero amount of water. So our dataset can look something like this, during a day with a couple of showers:

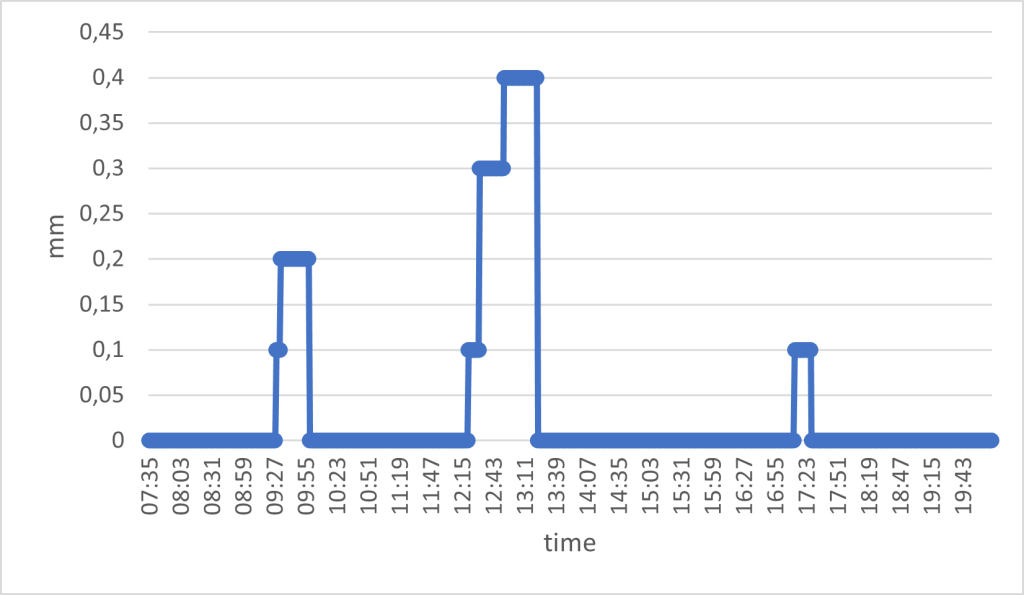
The water sensor works as a tipping bucket; it reports the amount of water in the bucket, and after a while it will empty the bucket. This means that the mm of water represents the total, accumulated amount of water in the bucket. As such, you will never see the amount decreasing; it will go from the max value to zero.

I am interested in understanding two things:
1. How many rain events occur per day
2. How much water is registered in each rain event

My data is stored in a PostgreSQL database (version 13). First, let’s define the data I have available:

Column nameData type
sensor_idvarchar
timestamptimestamp
no_measurementint
valuenumeric

Here’s an example of what the data can look like:

sensor_idtimestampno_measurementvalue
SPILD_SIFIX012023-07-03 07:35:00.00010
SPILD_SIFIX012023-07-03 07:36:00.00020
SPILD_SIFIX012023-07-03 07:37:00.00030.1
SPILD_SIFIX012023-07-03 07:38:00.00040
SPILD_SIFIX012023-07-03 07:39:00.00050.1
SPILD_SIFIX012023-07-03 07:40:00.00060.2
SPILD_SIFIX012023-07-03 07:41:00.00070
SPILD_SIFIX012023-07-03 07:42:00.00080
SPILD_SIFIX012023-07-03 07:43:00.00090.2
SPILD_SIFIX012023-07-03 07:44:00.000100.4
SPILD_SIFIX012023-07-03 07:45:00.000110.4

The first problem I need to solve is how to isolate rain events and figure out if a rain event has occurred over multiple measurements (aka through time).

By removing the zeros, I get the rain events. But how do I figure out whether a rain event continues over multiple measurements? My solution is to use the LAG function. This function looks backwards 1 row (1 is the default, it can be set to any amount of rows) and gives you the value of that row for a specific column. I can use this function, because I am given a measurement count column (“no_measurement”). This means that any concurrent measurement will have a no_measurement value the same as the previous + 1.

For example, a rain event is recorded with no_measurement = 8. If this measurement is part of a continuing rain event, the previous measurement should have no_measurement = 7 if it is the same rain event.

SELECT *,
  LAG(no_measurement) OVER(ORDER BY no_measurement) AS prev_meas
  FROM MyTable 
WHERE value!= 0::numeric
ORDER BY no_measurement

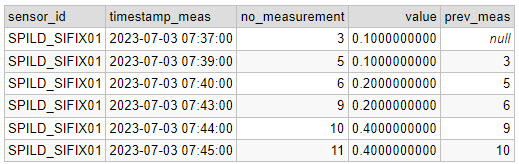
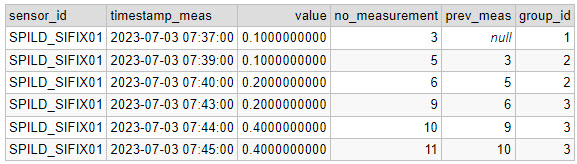
Now I have the expected previous no_measurement. Next step is to group the rain events (with a unique ID per group), by checking if the previous no_measurement fits with the current:

SELECT 
  sensor_id, 
  timestamp_meas, 
  value, 
  no_measurement,
  prev_meas,
  CASE WHEN m.prev_meas = no_measurement - 1 THEN currval('seq') ELSE nextval('seq') END AS group_id
FROM 
(SELECT *,  
  LAG(no_measurement) OVER(ORDER BY no_measurement) AS prev_meas
  FROM MyTable 
WHERE value != 0::numeric
ORDER BY no_measurement) m

Note that I am using a function called CURRVAL and NEXTVAL to give the groups a unique ID. I create a temporary sequence (called “seq”) from which I can get a unique ID using the CURRVAL/NEXTVAL. You create the sequence like this:

CREATE TEMPORARY SEQUENCE seq START 1;

Now I have given the 3 rain events unique IDs:

The final step is to use GROUP BY on the date, group_id, take the maximum measured value (because it is an accumulated value), add a start and end timestamp and calculate the duration of each event.

SELECT 
  DATE(timestamp_meas) AS date,
  sensor_id, 
  group_id, 
  ROUND(MAX(value),2) AS mm_in_total, 
  MIN(timestamp_meas) rain_start, 
  MAX(timestamp_meas) rain_end, 
  (EXTRACT(HOUR FROM MAX(timestamp_meas))-EXTRACT(HOUR FROM MIN(timestamp_meas))) AS duration_hour,
  (EXTRACT(MINUTE FROM MAX(timestamp_meas))-EXTRACT(MINUTE FROM MIN(timestamp_meas))) AS duration_minute
FROM (
  SELECT 
  sensor_id, 
  timestamp_meas, 
  value, 
  no_measurement, 
  prev_meas,
  CASE WHEN m.prev_meas = no_measurement - 1 THEN CURRVAL('seq') ELSE NEXTVAL('seq') END AS group_id
FROM 
(SELECT *, 
  LAG(no_measurement) OVER(ORDER BY no_measurement) AS prev_meas
  FROM MyTable 
WHERE value != 0::numeric
ORDER BY no_measurement) m) t
GROUP BY DATE(timestamp_meas), sensor_id, group_id
ORDER BY group_id

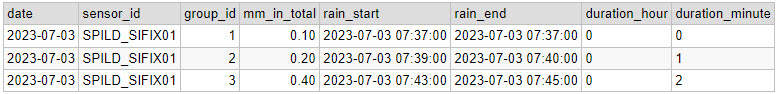
Reflecting on this solution, this query could also have been written as a CTE (common table expression), which I think would have made the query more readable. Here’s a nice example of such a solution.

Visualising the age of buildings: Copenhagen [QGIS]

Through the exellent newsletter quantum of sollazzo by Giuseppe Sollazzo (@puntofisso) I learned of the beautiful map of Paris by Naresh Suglani (@SuglaniNaresh), where Suglani have visualised the year of construction in a lovely blue-to-red colour gradient. It is a stunning visualisation, and I immediately wanted to try to make a similar version myself.

Here you can see Suglani’s original:

“Paris | Building Ages” by Naresh Suglani. September 2021.

In order to recreate this map I needed to get my hands on 1) the shapes of buildings in Copenhagen and 2) the year of construction.

The shape of buildings

Dataforsyningen is part of the Danish Agency for Data Supply and Efficiency, and they offer a range of datasets. One of them is the dataset INSPIRE – Bygninger. This dataset follows the INSPIRE directive by the European Union, which promotes the standardisation of the infrastructure for geographical data in Europe. The file contains polygons of the shape of buildings, which is what I needed. The file format is GML, which you can read about here.

This is a rather big file, because it is not possible to filter which part of Denmark you are interested in.

The age of the buildings

Unfortunately, the GML file does not contain a “date of construction” attribute, so I had to find that elsewhere.

From my current workplace, I know of a dataset called “BBR”, which stands for Bygnings- og Boligregistret (Building- and Housing Registry). This dataset contains information about housing plots, buildings, facilities etc. in a point format. I had a strong suspicion that BBR includes information about the year of construction, so I downloaded the dataset from Dataforsyningen, just like the buildings-dataset. This dataset is called INSPIRE – BBR bygninger og boliger, and comes in the geopackage file format (.gpkg).

Once again, we get a rather large file:

I open the file and — we are in luck! The point-file contains an attribute called “dateofcons” aka date of construction.

However, one thing stood out: Several buildings had the date of construction as the year 1000. Now I am no history major, but that seemed like a bit of a stretch. So I asked around, and it turns out that the BBR-dataset use the value 1000 as their “unknown” category. Not the most ideal choice in my opinion, but that’s how it is. Therefore I had to filter out the 1000-values in the dateofcons column for my visualisation.

Clipping the data

To follow the design of Suglani, I focused on central Copenhagen. I created a circular polygon encompassing most of the old town of central Copenhagen to use to clip the two datasets.

Then I was ready to clip the data to fit my circle:

And here are the results:

Building polygons to the left, BBR points on the right.

Next I needed to join the two datasets somehow, so that each building could have an attribute with its year of construction. For this I needed to do a join attributes by location.

By doing this kind of join I assumed that both datasets are near-perfect, i.e. that all buildings are registered at a high level of detail, and that the position of the BBR-points will not fall out of the building polygons. That is a large assumption to make, and there will probably be some errors. Let’s have a closer look at how well the two datasets match:

I would say this is an excellent fit, although there is at least one BBR-point which seems to be floating in the air, with no building-polygon nearby.

I ran the join tool, waited a few minutes, and voilá!

Not as elegant or interactive as Suglani’s original version, but I’m pretty satisfied!

I also made a light version in Danish:

Time series for SSM, ET and precipitation for Myanmar [Google Earth Engine]

Back in December 2018, I was in Yangon (Myanmar) to help facilitate a workshop on satellite-based remote sensing to support water professionals in the country. For this workshop, I created a script to calculate a time series for surface soil moisture, evapotranspiration and precipitation.

The data for this script are:

The first thing to do is to load the shapefile of Myanmar, using the LSIB dataset. We need to deal with the auto generated system:index, which otherwise causes some visualisation issues later on. The auto generated ID for the Feature could be something like 000000000000000092.

My solution is a bit of a ‘hack’, because in this specific case, I only have a single Feature in my FeatureCollection, i.e. the shapefile of Myanmar. That means that I can use .first() and .set() to change the system:index of the single Feature. In this instance, I change the system:index to Myanmar.

// Select country from list
var countries = ee.FeatureCollection("USDOS/LSIB/2017");
var fc = countries.filter(ee.Filter.inList('COUNTRY_NA',['Burma']));
print('Old system:index', fc);

// Change system:index from the auto generated name
var feature = ee.Feature(fc.first().set('system:index', 'Myanmar')); // .first() is used as there is just one Feature
var Myanmar = ee.FeatureCollection(feature);
print('New system:index', Myanmar);

// Add Myanmar and center map
Map.centerObject(Myanmar);
Map.addLayer(Myanmar, {}, 'Myanmar shapefile');

This gives the following output:

Now I load the imageCollections of the three datasets.

// Filter datasets for bands and period
var SSM = ee.ImageCollection('NASA_USDA/HSL/SMAP_soil_moisture')
      .select('ssm')
      .filterBounds(Myanmar)
      .filterDate(startdate, enddate);

var ET = ee.ImageCollection('MODIS/006/MOD16A2')
      .select('ET')
      .filterBounds(Myanmar)
      .filterDate(startdate, enddate);
      
var PRCP = ee.ImageCollection('UCSB-CHG/CHIRPS/DAILY')
      .select('precipitation')
      .filterBounds(Myanmar)
      .filterDate(startdate, enddate);

Next, I create a single image consisting of the mean of each imageCollection for the given time period. This is purely for visualisation purposes as you will see next.

// Calculate means for visualisation
var SSM_mean = SSM.mean()
  .clip(Myanmar);

var ET_mean = ET.mean()
  .clip(Myanmar);

var PRCP_mean = PRCP.mean()
  .clip(Myanmar);

I set the visualisation parameters, and add the data to my map.

// Set visualisation parameters    
var soilMoistureVis = {
  min: 10.0,
  max: 28.0,
  palette: ['0300ff', '418504', 'efff07', 'efff07', 'ff0303'],
};

var evapotranspirationVis = {
  min: 0.0,
  max: 300.0,
  palette: [
    'ffffff', 'fcd163', '99b718', '66a000', '3e8601', '207401', '056201',
    '004c00', '011301'
  ],
};

var precipitationVis = {
  min: 1.0,
  max: 30.0,
  palette: ['#ffffcc','#a1dab4','#41b6c4','#2c7fb8','#253494'],
};

// Visualize maps
Map.addLayer(SSM_mean, soilMoistureVis, 'SSM');
Map.addLayer(ET_mean, evapotranspirationVis, 'ET');
Map.addLayer(PRCP_mean, precipitationVis, 'PRCP');

That gives us the following output:


Now what we really want is a graph showing the development of the data through time. Due to the limited memory capacity of Google Earth Engine, I can’t get more than 1.5 month of data, but that is enough to have a look at the onset of the monsoon season in May/June.

I use the ui.Chart.image.seriesByRegion where the arguments are: imageCollection, regions, reducer, band, scale, xProperty, seriesProperty (last four are optional). In addition, I use .setOptions() to add a main title and axis titles.

// Define graphs
var SSMGraph = ui.Chart.image.seriesByRegion({
  imageCollection: SSM, 
  regions: Myanmar, 
  band: 'ssm',
  reducer: ee.Reducer.mean(),
  scale: 25000, // 25km resolution
}).setOptions({
        title: 'Average soil moisture',
        hAxis: {title: 'Date'},
        vAxis: {title: 'Soil moisture [mm]'}});
        
var ETGraph = ui.Chart.image.seriesByRegion({
  imageCollection: ET, 
  regions: Myanmar, 
  band: 'ET',
  reducer: ee.Reducer.mean(),
  scale: 500, // 500m resolution
}).setOptions({
        title: 'Average evapotranspiration',
        hAxis: {title: 'Date'},
        vAxis: {title: 'Evapotranspiration [kg/m^2]'}});

var PRCPGraph = ui.Chart.image.seriesByRegion({
  imageCollection: PRCP, 
  regions: Myanmar, 
  band: 'precipitation',
  reducer: ee.Reducer.mean(),
  scale: 5000, // ~5km resolution
}).setOptions({
        title: 'Average precipitation',
        hAxis: {title: 'Date'},
        vAxis: {title: 'Precipitation [mm/day]'}});

// Display graphs
print(SSMGraph);
print(ETGraph);
print(PRCPGraph);

Which gives us the following output:

Note that “Myanmar” appears in the legend of the graph. If we had not changed the system:index in the beginning, you would instead see something like “000000000000000092“.

Link to the entire script: https://code.earthengine.google.com/e9042e4ac5fc902d1ff58da10856965f